Positive Approaches Journal, Volume 8, Issue 3
J. Rachel Krouse, Kathleen E. Ammerman, Zachary L. Ulisse, and Timothy J. Runge | 28-46

Volume 8 ► Issue 3 ► 2019
School-Wide Positive Behavioral Interventions and Supports: A Promising Framework to Reduce Exclusionary Practices and Placements
J. Rachel Krouse, Kathleen E. Ammerman, Zachary L. Ulisse, and Timothy J. Runge
Abstract
School-wide positive behavioral supports and interventions (SWPBIS) is a comprehensive approach to addressing the social, emotional, and behavioral health of all students. Data from schools affiliated with the Pennsylvania Positive Behavior Support Network were analyzed to determine the extent to which SWPBIS is associated with reductions in restrictive disciplinary and educational-placement practices. High schools implementing SWPBIS reported significantly lower out-of-school suspensions over time. Further, results suggest that SWPBIS is associated with reductions in out-of-school placements for all student and students with emotional disturbance.
Introduction
Positive Behavior Supports is a broad term that defines an array of approaches designed to create changes in social behaviors that facilitate access to various ecologies.1 When applied in school settings (i.e. kindergarten through 12th grade), it is commonly referred to as School-Wide Positive Behavioral Interventions and Supports (SWPBIS). SWPBIS is a multi-tiered system of behavioral supports that employs evidence-based prevention and intervention strategies throughout all ecologies of a school 2 to support the behavioral, social, and emotional development of all students. SWPBIS can also create a more inclusive environment for students with disabilities.
There are three tiers within SWPBIS, termed tier 1 (primary), tier 2 (secondary), and tier 3 (tertiary). Tier 1 SWPBIS includes the assessment and instructional practices provided to all students to prevent or minimize barriers to learning while concurrently promoting inclusive educational practices for all students. 3 Additional assessments, interventions, and supports beyond the primary tier are required by approximately 15% – 30% of the school population. 4,5 These additional assessments, interventions, and supports are known as tier 2 SWPBIS. If students do not respond positively to the tier 1 or tier 2 interventions and supports, they are then provided tier 3 interventions and supports. This applies to approximately 5% – 10% of the students. Eber and colleagues 6 describe these services as student-centered and family-oriented given that there are often significant needs that extend across all the students’ ecologies.
There is growing evidence that SWPBIS is associated with positive outcomes for students, staff, and schools. For example, Lassen, Steele, and Sailor 7 found that adherence to SWPBIS procedures was significantly correlated with decreases in problem behaviors exhibited by students. When students display significant behavioral disruptions in the school environment, typically an office discipline referral (ODR) is issued. The empirical evidence regarding the extent to which SWPBIS implementation is related to decreases in ODR is robust. Flannery et al. 8 found a negative correlation between fidelity and ODRs in 12 high schools. Specifically, when the extent to which SWPBIS was implemented as prescribed (i.e., fidelity) increased, office disciplinary referrals significantly decreased.
Another indicator of discipline challenges in school settings is the occurrence of out-of-school suspensions (OSS) which often are the result of either a student’s chronic misbehavior in school or exhibition of extremely dangerous or illicit behavior. As is the case with ODRs, the empirical literature regarding SWPBIS and OSS is growing. Gage, Grasley-Boy, George, Childs, and Kincaid 9 found that high fidelity implementation of SWPBIS resulted in fewer OSS, particularly for students with disabilities and students of color. Thus, SWPBIS is an encouraging framework for reducing chronic and dangerous behavior for populations that are historically at risk for school failure.
Given the national evidence regarding the association of SWPBIS and reductions in OSSs, it was hypothesized that similar reductions in exclusionary disciplinary practices would be observed in data from Pennsylvania. Specifically, our first empirical question was to appraise the extent to which SWPBIS is associated with changes in OSS.
SWPBIS promotes implementation of evidence-based supports and practices across all settings, not limited to just the special education classroom. Consequently, Freeman and colleagues 10 hypothesized that SWPBIS: (a) creates environments in which all educators are equipped with the skills and resources to support the complex needs of students with disabilities in general education settings; and (b) students with disabilities can be included more with non-disabled peers as a direct result of increased skills of all educators and supports embedded within general education settings. Therefore, the extent to which SWPBIS is associated with providing the practices and supports necessary to educate students with disabilities in their least restrictive environment (LRE) was of interest and constituted our secondary empirical inquiry.
Relatedly, some students present with such significant academic, social, emotional, and/or behavioral needs that highly specialized and intensive services are necessary to help them maximally benefit from instruction. For some of these students,
their neighborhood school does not have the resources to provide the specialized and intensity of services they need. Consequently, out-of-school placements (OSP) are sometimes recommended. OSPs are a broad set of options available to
schools, families, and students, including non-neighborhood public schools, private schools, day-treatment centers, public and private residential facilities, homebound instruction, or instruction within a hospital setting. Leaders in SWPBIS
have articulated that reducing OSPs was one of the primary motivations for its development and implementation over two decades ago. 10,3 It is hypothesized that implementation of the multi-tiered SWPBIS framework may reduce the need for
OSPs, especially for students whose primary needs are focused on social, emotional, and / or behavioral functioning. This was our third line of inquiry.
Method
Data from the Pennsylvania Positive Behavior Support (PAPBS) Network database were analyzed to test these hypotheses. Briefly, the PAPBS Network includes affiliation of over 1,000 schools in Pennsylvania. Fidelity of implementation of
tier 1 SWPBIS and various student- and school-level outcomes are monitored annually by the Pennsylvania Department of Education. Data are voluntarily submitted by participating schools to a secure website. Data are then released by Pennsylvania
Department of Education to the research team at Indiana University of Pennsylvania per its Institutional Review Board for the Protection of Human Subjects approval. Because of the voluntary nature of data submission, not all schools regularly
submit fidelity of implementation and / or complete outcome data. As of spring 2019, 565 schools were implementing tier 1 SWPBIS with fidelity. The number of schools submitting partial or complete outcome data varies from one year to the
next and by outcome measure reported.
Out-of-School Suspensions
National data indicate out-of-school suspensions (OSSs) are used at statistically significant lower rates in elementary schools compared to secondary schools. 9,11 Therefore, PAPBS Network data were dichotomized into elementary and secondary
schools. Initial analyses of OSS data indicated that elementary schools consistently reported statistically significantly lower OSS rates than secondary schools (i.e., middle, junior/senior, and high schools), therefore subsequent analyses were
conducted separately for elementary and secondary schools.
Elementary Schools
A series of Friedman tests were conducted to assess whether OSS rates prior to tier 1 SWPBIS implementation changed once the framework was adopted. These non-parametric equivalents to the repeated-measures ANOVA are reported given violations of normality in the data; however, repeated-measures ANOVAs were also conducted for each analysis, producing identical results. In every instance, tier 1 SWPBIS was not associated with statistically significant changes in OSS rates across pre-implementation to multiple years of implementation. A longitudinal review of pre-implementation to the fourth year of tier 1 SWPBIS implementation is provided in Figure 1. For these 14 elementary schools, the OSS rates did not statistically change across any of the years of tier 1 SWPBIS compared to pre-implementation levels, X2(4) = 3.799, p = .434. Readers are cautioned that these data represent medians, not means; therefore, normative comparisons of OSS rates to national trends are inappropriate.
Figure 1. Annual Median OSS Days Served per 100 Students in Elementary Schools Pre-Implementation to Year 4
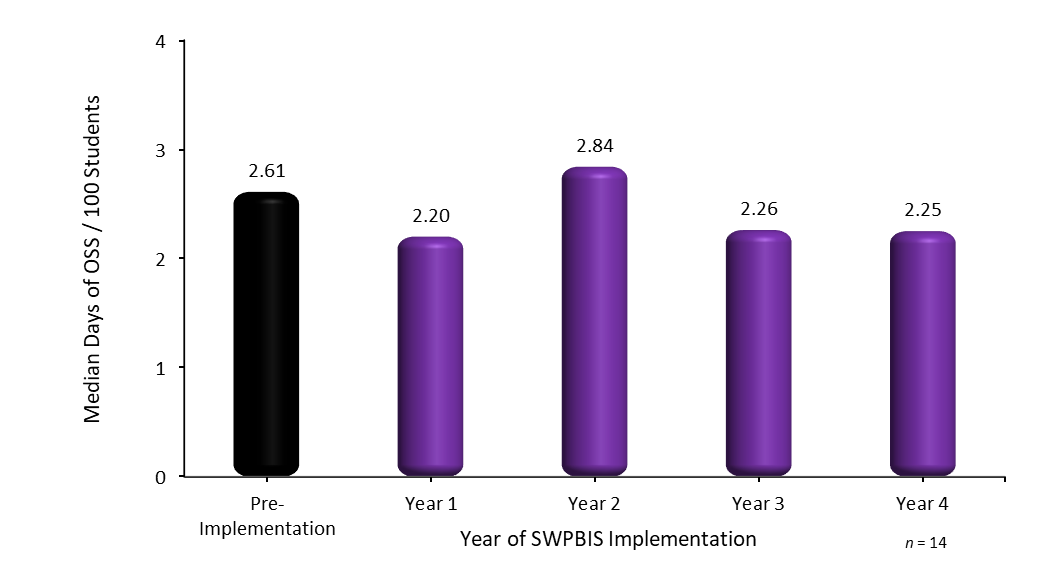
Note. OSS = out-of-school suspension; median OSS rates did not significantly change from one year to another.
Secondary Schools
Parametric statistical analyses were conducted with secondary school data given that assumptions of these procedures were all met. Non-parametric equivalent procedures were also employed as confirmation, although these results are not presented here. As displayed in Figure 2, OSS rates statistically significantly declined across pre-implementation to year 2 of tier 1 SWPBIS, F(3, 24) = 3.719, p = .025, for a group of 18 secondary schools. Inspection of the pairwise comparisons, via Bonferroni post hoc tests, indicated that the greatest decline in OSS rates was from pre-implementation to year 1, representing an initial 36% reduction in OSS rates in the first year of Tier 1 SWPBIS. OSS rates from year 1 to year 2 remained statistically similar.
Figure 2. Longitudinal Average OSS Days Served per 100 Students in Secondary Schools from Pre-Implementation to Year 2
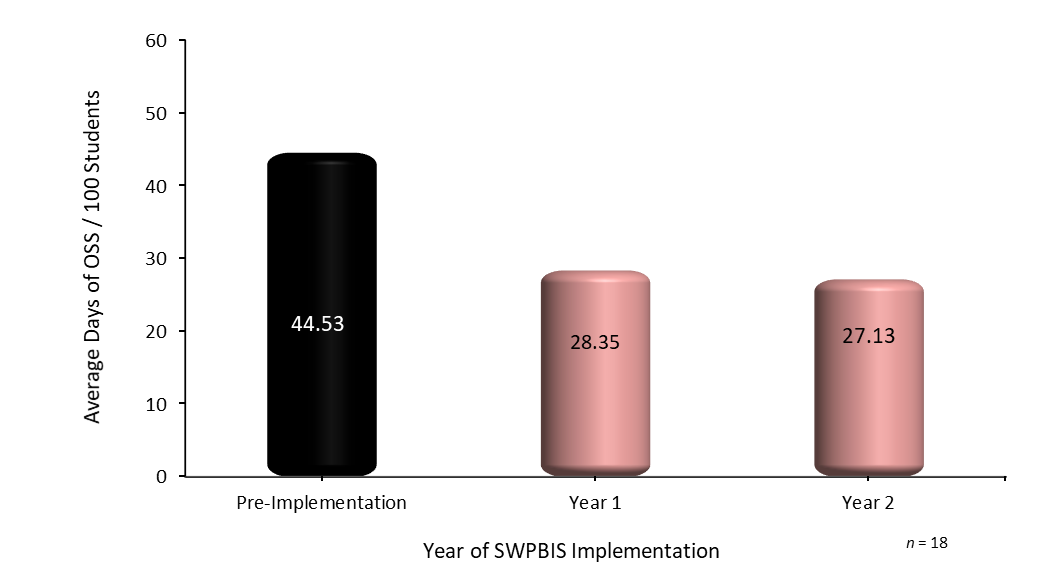
Note. OSS = out-of-school suspensions. OSS rates statistically significantly declined from pre-implementation to year 1 and remained statistically similar from year 1 to year 2.
Similar reductions in the first year of tier 1 SWPBIS adoption followed by sustained OSS rates in subsequent years were noted in analyses of longer duration (e.g., pre-implementation to year 3), although those analyses were based on small sample sizes.
For example, a 5-year longitudinal analysis of 10 secondary schools that supplied pre-implementation and year 4 fidelity and OSS data (but not necessarily complete data during the interim years) was also statistically significant, t(9) = 2.649,
p = .027.
Least Restrictive Environment
Schools submit the number of students who are educated in three state-defined categories of LRE. These categories are based on the proportion of time a student with a disability is educated with non-disabled peers. The three categories are: (a) ≥80% of the school day in a general education classroom; (b) 40-79% of the school day in a general education classroom; and (c) <40% of the school day included with non-disabled peers. Data on the proportion of students with disabilities educated in the three respective LRE categories were used in the analyses.
The first empirical inquiry for LRE focused on whether the LRE indices varied as a function of building type. A series of ANOVAs with applicable Bonferroni post hoc analyses were conducted at pre-implementation and each subsequent year of SWPBIS implementation to evaluate the extent to which LRE indices differed by elementary, middle, K-8, junior / senior, and high schools. Overall, none of the F tests or post hoc analyses were statistically significant, indicating that LRE indices are comparable across building types. Therefore, data were aggregated across elementary, middle, K-8, junior / senior, and high schools.
For schools that submitted both fidelity and outcome data, a series of pre-post comparisons were conducted to analyze differences in LRE placement across multiple years of SWPBIS implementation. These analyses suggest that the most inclusive categories of LRE placement (proportion of students in the ≥80% and 40%-79% of the school day educated in regular education setting categories) did not significantly change over multiple years of implementation; however, the results also suggest that the most exclusive category of LRE (<40% of the school day spent in a regular education setting) decreases after multiple years of SWPBIS implementation. For example, there was a statistically significant decrease in the proportion of students educated in the most restrictive environment starting two years after implementation, and this reduction continued to occur until year 5 post-implementation. A visual display of these results is presented in Figure 3.
Figure 3. Longitudinal LRE Percentages
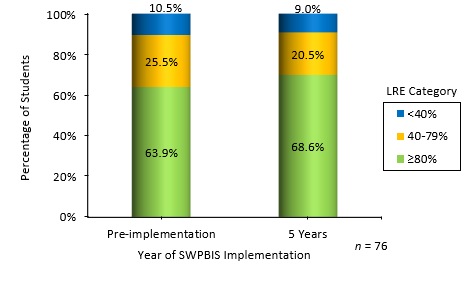
Note. The percentage of students in the ≥80% LRE index did not statistically change by Year 5; the percentage of students in the 40-79% LRE index did not statistically change by Year 5; the percentage of students in the <40% LRE index statistically
significantly decreased by Year 5.
Out-of-School Placements
OSPs were operationalized as the rate of OSP for all students per 100 students enrolled in the school and the rate of OSP for students identified as emotionally disturbed per 100 students enrolled. A series of ANOVAs with Bonferroni post hocs were conducted using cross-sectional data to evaluate the extent to which tier 1 SWPBIS is associated with changes in OSPs. Kruskal-Wallis H tests were conducted as well given the violation of the normality assumption of the ANOVA, although the results were similar to the parametric tests and are thus not reported here.
Across pre-implementation and multiple years of SWPBIS and across all OSP metrics, elementary schools were statistically similar to middle and K-8 schools. For example, the mean rate of placing any student in an OSP in the year prior to SWPBIS implementation
was statistically similar, F(2, 153) = 0.826, p = .440. The mean rate of placing students identified as emotionally disturbed in OSP was also statistically similar in the year prior to SWPBIS implementation, F(2, 150) =
2.581, p = .079. Similarly, elementary, middle, and K-8 schools in their first year of SWPBIS were statistically similar in their OSP rates for all students, F(2, 204) = 0.752, p = .473, and in their OSP rates for students
identified as emotionally disturbed, F(2, 210) = 2.405, p = .093. This pattern of similar results across elementary, middle, and K-8 persisted in subsequent years of SWPBIS implementation to at least the fifth year of SWPBIS at
which time sample sizes became too small to test for differences.
For many, but not all, of the years of implementation and OSP outcomes, high schools were statistically significantly different from elementary, middle, and K-8 schools. For example, high schools (M = 4.85 per 100 students) used OSPs with
all students at statistically significantly higher rates than elementary, middle, and K-8 schools (M = 1.37 per 100 students) in the year prior to SWPBIS implementation, t(182) = -4.629, p = .000. High schools also used
OSPs with students identified as emotionally disturbed (M = 1.24 per 100 students) at statistically significantly higher rates than elementary, middle, and K-8 schools (M = 0.404 per 100 students), t(178) = -4.695, p =
.000, during the year prior to SWPBIS implementation. Similar statistically significant differences were found in the other years of SWPBIS implementation, although results are not presented here. Therefore, subsequent OSP analyses were
completed on elementary, middle, and K-8 schools separately from high schools.
Elementary, Middle, and K-8 Schools
Longitudinal OSP rates for all students and students identified as emotionally disturbed submitted by schools implementing SWPBIS for one to four years are presented in Figure 4. Importantly, pre-implementation OSP rates are not presented in these
results. Paired-samples t-tests revealed that OSP rates for all students statistically significantly declined from year 1 to year 4, t(51) = 2.148, p = .036. OSPs for all students dropped from an average of 1.22 OSPs per
100 students in year 1 to an average of 0.74 OSPs per 100 students in year 4. Similarly, OSP rates for students identified as emotionally disturbed approached statistically significant mean differences from year 1 to year 4, t(52) = 1.937,
p = .058. OSPs for students identified as emotionally disturbed dropped from an average of 0.41 per 100 students in year 1 to an average of 0.22 per 100 students in year 4.
Figure 4. Longitudinal Analysis of Out-of-School Placements for All Students and Students with Emotional Disturbance per 100 Students for Elementary, Middle, and K-8 Schools After SWPBIS is Adopted
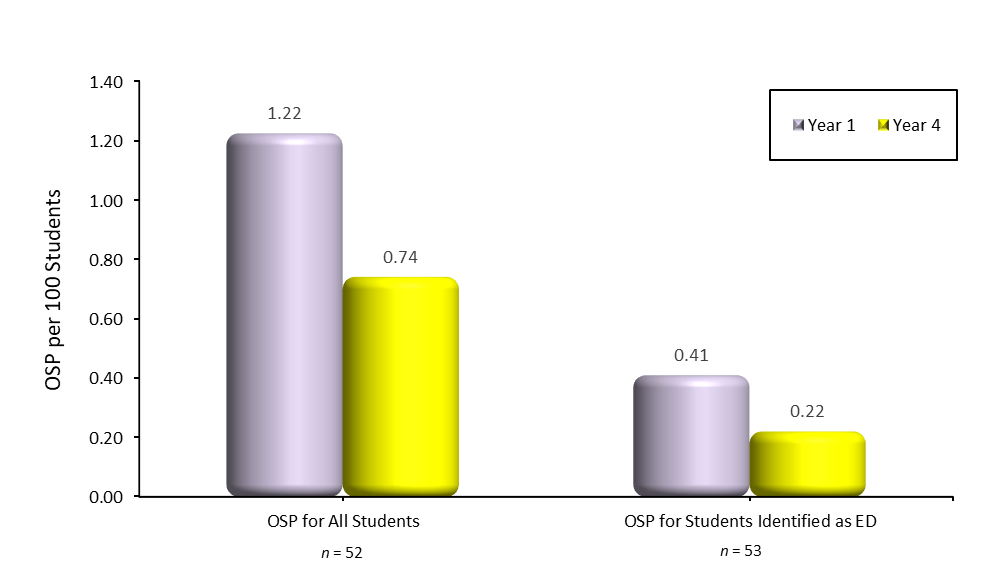
Note. OSP = Out-of-School Placement; ED = emotional disturbance. OSP for all students and for students identified as emotionally disturbed were statistically significantly lower at the fourth year of SWPBIS compared to the first year
of SWPBIS.
High Schools
An insufficient number of high schools submitted complete fidelity and OSP data to permit data analyses to be conducted. Further, reporting of the few high schools that did submit these data would violate the schools’ promised confidentiality.
Therefore, these data will be monitored in future years in the hope that more robust amounts of data will be available to review and report.
Discussion
SWPBIS is viewed as a promising school reform framework to address, among many things, exclusionary practices for students with social, emotional, and behavioral challenges. Data from the PAPBS Network indicate that SWPBIS is associated with a number of positive outcomes for all students, and in particular, students with disabilities. Specifically, these findings suggest that SWPBIS is associated with statistically significant reductions in OSS in secondary schools. Such reductions appear to occur within the first year of SWPBIS implementation. Similar reductions in OSS were not observed in elementary schools, although it is noted that OSS rates in PAPBS Network elementary schools are very low anyway. Still, reductions in elementary schools’ use of OSS would be ideal.
Data from PAPBS Network schools suggests a statistically significant association between SWPBIS implementation and reductions in the most restrictive educational placement for students with disabilities. This conclusion is made with considerable caution, however, for a number of reasons. First, SWPBIS alone is likely not the sole impetus of reductions in restrictive placements, particularly given that most students with special education needs require substantial academic support. It is likely that SWPBIS is a necessary, but insufficient, framework to promoting more inclusive practices for all students with special needs. Further, considerable work has occurred across Pennsylvania and the nation to promote other inclusive practices, including standards-based education and use of empirically-supported curriculum that employ evidence-based instructional practices, which likely result in more inclusive educational placements for students with disabilities. Therefore, the apparent reductions in the most restrictive education placement in the data reported in this study are likely due to a number of factors, with SWPBIS contributing only a small amount toward more inclusive practices. Despite this caution, it is encouraging to observe more inclusive practices in SWPBIS schools.
Finally, these data suggest that SWPBIS is, at least in part, associated with reductions in OSPs for all students and students with a primary classification of emotional disturbance. Such findings appear to support the contention made by Freeman
and colleagues 10 that SWPBIS will create environments that are more supportive of students’ needs. This conclusion, as with the previous conclusions, is made cautiously given these preliminary findings. Replication of results
with larger sample sizes is necessary before stronger conclusions can be made.
Limitations
The first limitation to these findings is the lack of a control group to compare with SWPBIS schools. This methodological limitation was partially addressed via longitudinal analyses whereby schools served as their own control. Future work
must include control groups, however, to mitigate the potential influence of time and the social milieu that is lost when aggregating data over the 10-year period of this project. Another limitation of this study includes the abnormality of
the data in some of the analyses. When reviewing OSS data, most schools engage in these practices infrequently. There are a handful of schools, however, that administer these types of disciplines very frequently. This skews the data
distribution and thus makes it difficult to find any significant results. This limitation was partially addressed by employing non-parametric data analytic procedures and using parametric equivalents as validation. Also, the relatively
small sample size of schools that submitted data was a limitation. As was noted earlier, 565 schools have achieved full implementation of tier 1 SWPBIS; however, a very small proportion of those schools submitted complete data for the analyses
reported in this study. It is possible that a bias exists in the dataset where only those schools that achieved positive outcomes voluntarily submitted their data. Conversely, a school that did not achieve desirable outcomes might withhold
its data, thus resulting in a biased dataset with which to conduct data analyses.
Future Study
As more schools begin to reach full fidelity and submit data for all three tiers of SWPBIS, future studies can be conducted on these larger samples using the same methodology. Also, different SWPBIS procedures can be looked at more closely and compared across different schools. For example, are there certain SWPBIS practices or procedures that are different across certain schools which may help explain the differences in utilization of OSS? Are there certain practices that influence the tendency for certain schools to be more inclusive in terms of LRE? These, and other important questions, will continue to shape the practice of developing educational environments that meet the needs of all students.
References
- Kincaid, D., Dunlap, G., Kern, L., Lane, K. L., Bambara, L. M., Brown, F.,…Knoster, T. P. Positive behavior support: A proposal for updating and refining the definition. Journal of Positive Behavior Interventions. 2016; 18: 69-73. doi: 10.1177/1098300715604826
- Algozzine, B., Barrett, S., Eber, L., George, H., Horner, R., Lewis, T., & Sugai, G. School-wide PBIS tiered fidelity inventory. Eugene, OR: National Technical Assistance Center on Positive Behavioral Interventions and Supports. Retrieved from www.pbis.org. 2014.
- Sugai, G., & Horner, R. H. Schoolwide positive behavior support. In W. Sailor, G. Sugai, G. Dunlap, and R. Horner (Eds.). Handbook of positive behavior support. New York, NY: Springer Science + Media; 2009: 307-326.
- Gottfredson, G. D., & Gottfredson, D. C. A national study of delinquency prevention in schools: Rationale for a study to describe the extensiveness and implementation of programs to prevent adolescent problem behavior in schools. Ellicott City, MD: Gottfredson Associates; 1996.
- Walker, H. M., Ramsey, E., & Gresham, F. M. Antisocial behavior in schools: Evidence -based practices (2nd ed.). Belmont, CA: Wadsworth / Thomson Learning; 2005.
- Eber, L., Hyde, K., Rose, J., Breen, K., McDonald, D., & Lewandowski, H. Completing the continuum of schoolwide positive behavior support: Wraparound as a tertiary-level intervention. In W. Sailor, G. Sugai, G. Dunlap, and R. Horner (Eds.). Handbook of positive behavior support (pp. 671-704). New York, NY: Springer Science + Media; 2009.
- Lassen, S., Steele, M., & Sailor, W. The relationship of school‐wide Positive Behavior Support to academic achievement in an urban middle school. Psychology in the Schools. 2006; 43: 701-712. doi: 10.1002/pits.20177
- Flannery, K. B., Fenning, P., McGrath Kato, M., & McIntosh, K. Effects of school-wide positive behavioral interventions and supports and fidelity of implementation on problem behavior in high schools. School Psychology Quarterly. 2014; 29: 111-124. doi: 10.1037/spq0000039
- Gage, N. A., Grasley-Boy, N., George, H. P., Childs, K., & Kincaid, D. A quasi-experimental design analysis of the effects of school-wide positive behavior interventions and supports on discipline in Florida. Journal of Positive Behavior Interventions. 2019; 21: 50-61. doi: 10.1177/1098300718768208
- Freeman, R., Eber, L., Anderson, C., Irvin, L., Horner, R., Bounds, M., & Dunlap, G. Building inclusive school cultures using school-wide pbs: Designing effective individual support systems for students with significant disabilities. Research & Practice for Persons with Severe Disabilities. 2006; 31: 4-17. doi: 10.2511/rpsd.31.1.4
- Spaulding, S. A., Irvin, L. K., Horner, R. H., May, S. L., Emeldi, M., Tobin, T. J., & Sugai, G. Schoolwide social-behavioral climate, student problem behavior, and related administrative decisions: Empirical patterns from 1,510 schools nationwide.
- Journal of Positive Behavior Intervention. 2010; 12: 69-85. doi:10.1177/1098300708329011 School-Wide Information System. SWIS summary. Eugene, OR: Educational & Community Supports. Retrieved from pbisapps.org; 2017.
Biographies
J. Rachel Krouse, M.Ed., is a third-year doctoral student currently enrolled in the Indiana University of Pennsylvania School Psychology PhD program. She has been involved with School-Wide Positive Behavioral Interventions and Supports research for more than two years.
Kathleen E. Ammerman, M.Ed., is a third-year doctoral student currently enrolled in the Indiana University of Pennsylvania School Psychology PhD program. She has been involved with School-Wide Positive Behavioral Interventions and Supports research for more than two years.
Zachary L. Ulisse, M.Ed., is a second-year doctoral student currently enrolled in the Indiana University of Pennsylvania School Psychology PhD program.
Timothy J. Runge, PhD, NCSP, BCBA is a Professor and Chair of the Educational and School Psychology Department at Indiana University of Pennsylvania. He has more than 20 years of experience implementing, consulting, and conducting research on School-Wide Positive Behavioral Interventions and Support.
Timothy J. Runge, PhD, NCSP, BCBA,
Indiana University of Pennsylvania,
1175 Maple Street, Stouffer 246C,
Indiana, PA 15705