
Positive Approaches Journal, Volume 9, Issue 3
Whitaker | 56-66

Volume 9 ► Issue 3 ► 2020
Using Community Data to Inform Services
Julie Whitaker
Introduction
We live in a world that is focused on and driven by data. Sports, education, healthcare, and entertainment all benefit from the power of data to tell compelling stories and provide customized experiences. There are numerous data-driven resources available that can help organizations provide targeted services to their members, including several that could help Pennsylvania’s Office of Developmental Programs (ODP) make informed decisions to strengthen services for Pennsylvanians with disabilities. In this article, I will highlight free sources of data and data visualizations (Walk Score, the American Community Survey, and DataUSA) and provide suggestions on how to capitalize on them.
Walk Score1
 Walk Score is a website
that provides information about transportation, entertainment, shopping, safety, housing, and community amenities. It rates locations based on their walkability, bikeability, and public transit options. It is easily searchable- simply enter a town,
city, or exact address in the search bar at the top of the homepage of walkscore.com
Walk Score is a website
that provides information about transportation, entertainment, shopping, safety, housing, and community amenities. It rates locations based on their walkability, bikeability, and public transit options. It is easily searchable- simply enter a town,
city, or exact address in the search bar at the top of the homepage of walkscore.com
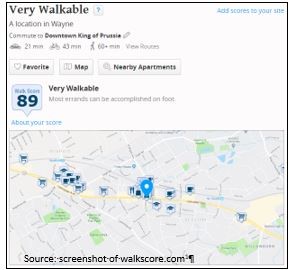 After the search, the results are presented on a one-page site
with interactive maps. The site allows you to search distances between housing options and grocery stores, cafes, and public transportation opportunities. It also gives a brief history of the area/town.
After the search, the results are presented on a one-page site
with interactive maps. The site allows you to search distances between housing options and grocery stores, cafes, and public transportation opportunities. It also gives a brief history of the area/town.
How can this be used?
The community data provided by Walk Score can be used in a variety of ways:
- Include Walk Score data in informational flyers for ODP participants and their families who are new to Pennsylvania.
- Suggest providers use Walk Score to create welcome brochures for new members which identify important community resources and provide options on how to get there.
- Inform ODP staff about employment, housing, education, and healthcare gaps and opportunities in communities across Pennsylvania.
- Information can also be used to frame dialogue about challenges and be considered when developing solutions.
The American Community Survey
The American Community Survey (ACS) is a demographic survey that is conducted by the U.S. Census Bureau. Unlike the Census, which is conducted every 10 years, ACS surveys a representative sample of the U.S. population every year. The American Community
Survey data is comprehensive, but thankfully easily searchable. It provides data tables that present disability-specific data.
The easiest way to find disability-related information in the ACS is by going to the Subject Tables section of the ACS using this link:
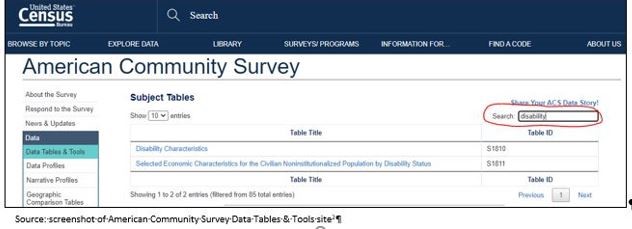
https://www.census.gov/acs/www/data/data-tables-and-tools/subject-tables/. Typing the search term “disability” in the tables search bar will yield results directly related to disability characteristics.
Table S1810, “Disability Characteristics,” is a good starting point to get basic information about numbers of individuals with disabilities nationally, in Pennsylvania, or in a county therein. Data included in this table include race information, age distribution, and number and percentage of individuals in each disability category.
After selecting the Disability Characteristics table, you can customize the information presented in the table to Pennsylvania or a county in Pennsylvania by clicking the “Customize Table” button. It will show options to fine tune the table to your specifications,
with the “Geographies” button being the most relevant:
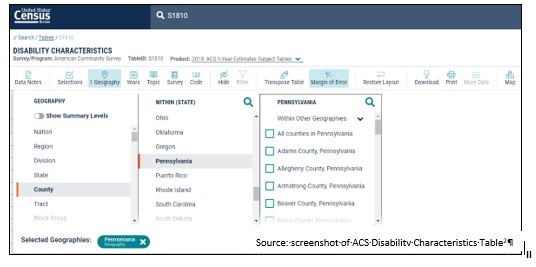
Though I have only shown how to get the table to focus in by county in this image, it is also possible to gather information specific to zip codes, state legislative districts, urban areas, school districts, and more. Once you have decided which of
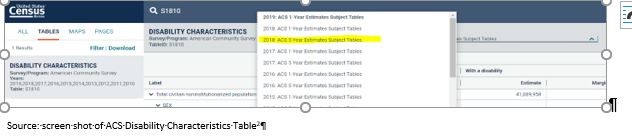
geographic area to focus on, be sure that the table being shown is the most up-to-date ACS 5-year estimate, since the sample size is larger and will provide the most statistically precise information. To select this option, there is a drop-down menu
labeled “Product” and various options will appear, like in the image below:
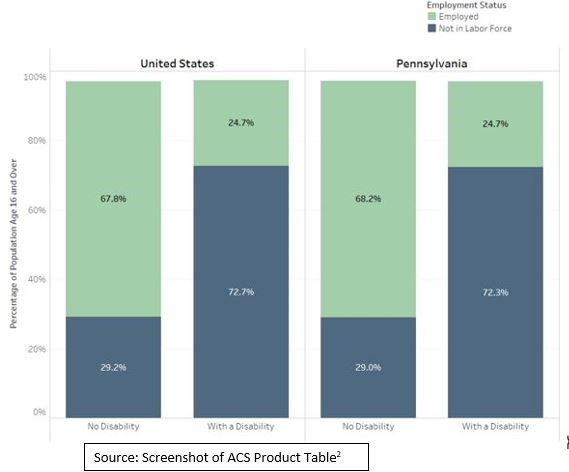
The ACS has another table that contains disability data available, Table S1811 “Selected Economic
Characteristics for The Civilian Noninstitutionalized Population By Disability
Status.” Using the same process as above (clicking customize table, customizing geography, and then using the “Product” drop-down menu to choose 2018: ACS 5-Year Estimates Subject Tables), you can explore data related to employment status, earnings,
graduation rates, and even poverty status. This data can be employed to visualize educational attainment, earnings, and employment of individuals with disabilities as compared to individuals without disabilities. Furthermore, data can be used to make
comparisons to national trends or create county-to-county comparisons:
How can ACS Data be used?
- Inform discussions around program priorities and funding. For example, if the data show that population of adults with cognitive disabilities is greater than the population of children with disabilities, ODP may consider investing more resources in developing adult program options.
- Create visualizations of employment, salary, educational attainment, age distribution, and disability type across Pennsylvania to help support policy recommendations and program focus.
- Educate staff, participants, families, providers, and other stakeholders about successes and areas of opportunities for individuals with disabilities in Pennsylvania, counties, and other geographies.
DataUSA
 An article about free data sources would not be complete without mentioning the comprehensive and visually compelling DataUSA.io site. Created by Deloitte and Datawheel, DataUSA uses a variety
of federal data sources (including the ACS!) to create understandable and attractive visualizations on a variety of topics including sports, tobacco use, air transportation, wages, occupations, education, and more at the national, state, and county
level. There are hundreds of topics to explore, but I will be focusing on how the Pennsylvania-specific data can be used to educate and support ODP initiatives and programs.
An article about free data sources would not be complete without mentioning the comprehensive and visually compelling DataUSA.io site. Created by Deloitte and Datawheel, DataUSA uses a variety
of federal data sources (including the ACS!) to create understandable and attractive visualizations on a variety of topics including sports, tobacco use, air transportation, wages, occupations, education, and more at the national, state, and county
level. There are hundreds of topics to explore, but I will be focusing on how the Pennsylvania-specific data can be used to educate and support ODP initiatives and programs.
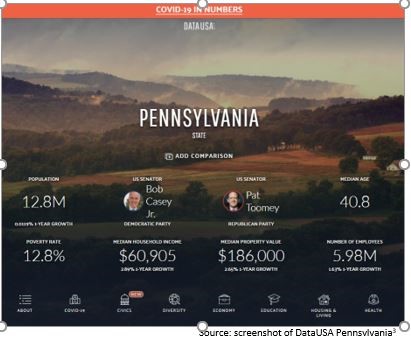
The data and visualizations can be accessed by clicking the icons at the bottom of the Pennsylvania’s informative landing page. For example, after clicking diversity one is led to the following visualization about Pennsylvania’s population characteristics:
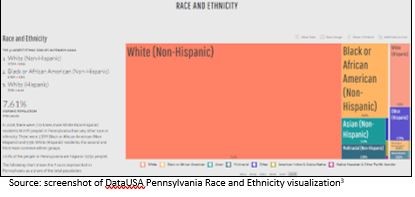 The data visualization goes back a few years to show population trends over time. State level information is available about numerous topics including population characteristics, education opportunities, voting behavior, and community health.
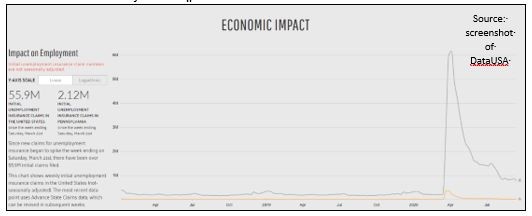
DataUSA has also provided COVID-19 data and visualizations in the COVID-19 in the United States portion of their website. Though there is a slight lag in the data, it produces visualizations that show new cases, community mobility, economic impact, ICU bed availability, and risk and readiness in the United States as a whole and by state.
How can DataUSA be used?
- Include attractive visualizations in training and other organizational materials to help support policy recommendations and justify program changes.
- Educate staff, participants, families, providers, and other stakeholders about successes and areas of opportunity for improving quality of life in Pennsylvania.
- Keep participants, families, providers, and other stakeholders up to date on the latest COVID-19 numbers.
- More easily employ data to educate participants, families, ODP staff, and providers on important topics affecting their communities and state.
Final Thoughts
Data provides us with opportunities to learn and teach others about the communities in which we live. It can help inform training curriculum for professionals; educate participants, families, and providers about community resources; and inform policy changes. Using data in publications to help families settle into a new place can lead them to make the best housing and employment decisions for their family. Showing data trends over time can help answer the “why” of a big change that may be necessary at the organizational level. Presenting data in visually appealing ways can help people understand it better. When using data from these websites, it’s important to cite your sources each time, which gives credit to the organization for having gathered the information and/or created the visualization. Examples of simple ways to do this can be seen in the visuals throughout this article.
References
1. Wayne, Pennsylvania. Walk Score website. Updated 2020. https://www.walkscore.com/score/124.dash.130-w-lancaster-ave-wayne-pa-19087
Accessed September 28, 2020.
2. Understanding and Using American Community Survey Data: What All Data Users Need to Know. Disability Characteristics (Table S1810). Selected Economic Characteristics for the Civilian Noninstitutionalized Population by Disability Status (Table S1811). American Community Survey, U.S. Census Bureau website. https://www.census.gov/programs-surveys/acs/guidance/handbooks/general.html, https://data.census.gov/cedsci/table?q=S1810&tid=ACSST1Y2019.S1810, https://data.census.gov/cedsci/table?q=S18&d=ACS%201-Year%20Estimates%20Subject%20Tables&tid=ACSST1Y2019.S1811. . Updated 2020. Accessed September 27, 2020.
3. Pennsylvania. DataUSA website. https://datausa.io/profile/geo/pennsylvania. Updated 2020. Accessed September 28, 2020
Biography
Julie Whitaker is a project coordinator at the A.J. Drexel Autism Institute. Prior to joining the Autism Institute in April 2020, she worked as a research and project specialist at the Arizona Developmental Disabilities Planning Council, where she focused on educating the policy makers and community members about health, safety, transportation, self-advocacy, and policy issues.
Contact Information
Julie Whitaker
Project Coordinator
A.J. Drexel Autism Institute