
Positive Approaches Journal, Volume 9, Issue 3
Verstreate | 50-55

Volume 9 ► Issue 3 ► 2020
COVID-19
Data Visualization Highlight
Kate Verstreate, MPH
Introduction
The sense of uncertainty that has accompanied the COVID-19 pandemic has led our global community to turn to data. Over the past several months you may have found yourself regularly asking the following questions: How many cases are in my county? How does my state compare to the rest of the country? Or simply, Should I be concerned? News outlets and social media streams have been flooded with heat maps and bar charts depicting data related to the pandemic. With such an influx of information and data surrounding COVID-19, data visualizations are here to help make sense of it all.
As COVID-19 cases rose in late March, we also saw a spike in data visualizations. Heat maps illuminated outbreaks in cities like New York and Detroit, bar charts revealed increasing numbers of daily cases, and models encouraged us to “flatten the curve”. Powerful data dashboards aimed at communicating vital information have been emerging on the global scale, at all levels of U.S. government, and even universities. Data visualizations have been a pivotal tool in keeping the public informed and driving government regulations during this time. Perhaps one of the only positive aspects to come from the COVID-19 pandemic has been the integration of data into our everyday lives. Educating the public on how to make sense of data visualizations will keep our communities better informed long after the pandemic ends. These types of data visualizations are helpful in communicating results and allowing for data driven decisions.
Impactful Data Dashboards
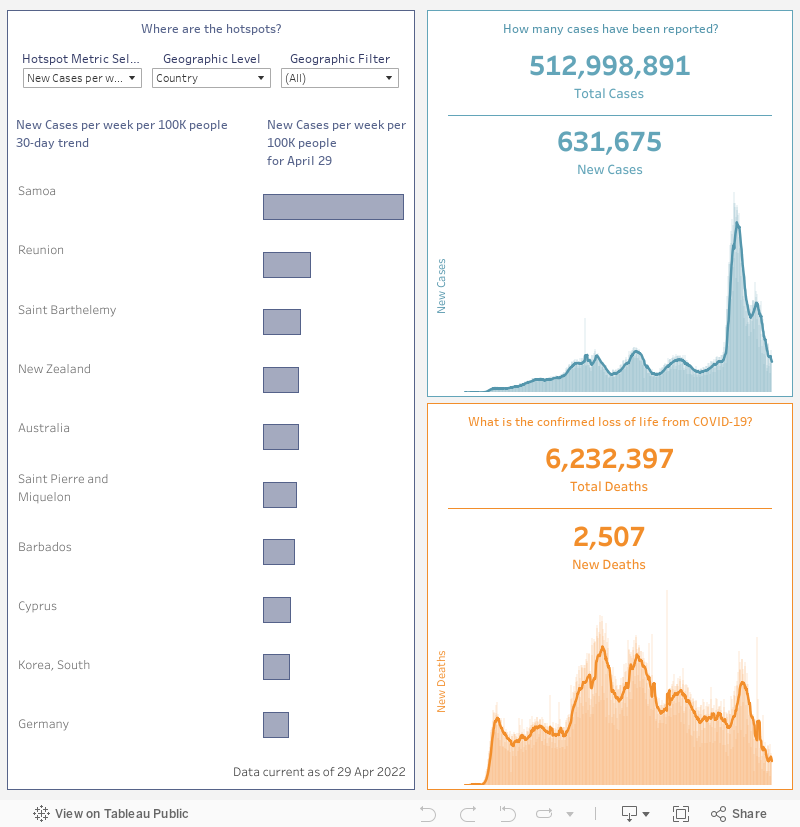
As revolutionaries in the field of data visualization, it comes of little surprise that Tableau has published data dashboards aimed at identifying hotspots and trends in the COVID-19 pandemic on a global scale. Tableau’ COVID-19 Data Hub1 is not only focused on visualizing these trends, but also helping to connect data users to powerful datasets published by the University of Oxford, The University of Washington, and The COVID Tracking Project at The Atlantic. The dashboard below compares cases and deaths per capita globally, by state/providence (Canada and United States only), and by county (United States only). By hovering over aspects of the dashboard, users can see the rate of cases and deaths per one-hundred thousand people within the past 30 days. The right-hand portion of this dashboard focuses on the total number of cases/deaths since the beginning of the pandemic as well as the incidence of cases/deaths at the current day.
Johns Hopkins University & Medicine has been a leading force in the visualization of COVID-19 data since the pandemic first began. Their Coronavirus Resource Center2 houses a multitude of data driven dashboards that examine both
testing and tracking data that are updated daily. The interactive map of the United States produced by the Johns Hopkins Centers for Civic Impact below gives viewers a full picture of the COVID-19 pandemic within the U.S. In this single dashboard
we can see total number of cases and deaths as well as cases and deaths per capita, all at the county level. The dashboard also highlights counties that are leading in confirmed COVID-19 cases and deaths. To get more detail on a county of interest,
click on a county of interest and a tooltip will appear with a COVID-19 status report. In these county status reports you will find more detail on the county’s demographic makeup, hospital capacity, and COVID-19 case and death information.
County level health departments have also been leveraging data visualizations to help communicate the effect COVID-19 has had on their community members. A shining example of this has come out of Allegheny County. The below dashboard housed on the Allegheny County Health Department’s website3 shows a comprehensive view of the COVID-19 situation within the county, highlighting cases, deaths, tests administered, hospitalizations, and ICU admissions. The creators of this dashboard also accounted for differences in demographic groups, allowing viewers to see results stratified by age group, gender, race, and residential zip code. Another impactful aspect of this dashboard can be found in the lower half of the visual. Here viewers can see that not only confirmed cases are being captured, but also probable cases are included in cases by day and deaths by day bar graphs. Including these probable cases accounts for individuals who showed symptoms of COVID-19 and were in contact with someone who tested positive for COVID-19 but did not have a positive test result themselves. Including these probable cases helps to show a more accurate assessment of the county’s status. Despite being packed with compelling data, in the lower right-hand corner the dashboard links viewers to a more detailed look at the definitions/methodology used, testing data, cases data, and rates by demographics.
Conclusions
With so much misinformation surrounding the COVID-19 pandemic, it is crucial to stay informed and more importantly, to listen to the data. When exploring any type of data dashboard or viewing a figure, as always, it is important to verify that
the data is being derived from a trusted source. Becoming more comfortable with interpreting data visualizations, will allow us to make better informed decisions in the workplace or even in our personal lives.
Additional COVID-19 Data Visualizations Examples
Centers for Disease Control and Prevention (CDC): COVID Data Tracker4
World Health Organization (WHO): Coronavirus Disease (COVID-19) Dashboard5
Johns Hopkins University & Medicine: Testing Trends Tool6
Johns Hopkins University & Medicine: Impact of Opening and Closing Decisions by State7
Pennsylvania Department of Health: COVID-19 Data for Pennsylvania8
Philadelphia Health Department: COVID-19 Overview9
UNC-Chapel Hill: COVID-19 Tracking11
The State University of New York: COVID-19 Case Tracker12
References
- COVID-19 (Coronavirus) data resource hub. Tableau website. https://www.tableau.com/covid-19-coronavirus-data-resources. Accessed October 30, 2020.
- COVID-19 United States cases by county - Johns Hopkins Coronavirus resource center. Johns Hopkins Coronavirus Resource Center website. https://coronavirus.jhu.edu/us-map. Accessed October 30, 2020.
- COVID-19. Allegheny County Health Department website. https://www.alleghenycounty.us/Health-Department/resources/COVID-19/Covid-19.aspx. Accessed October 30, 2020.
- CDC COVID-19 data tracker. Centers for Disease Control website. https://covid.cdc.gov/covid-data-tracker/#cases_casesinlast7days. Accessed October 30, 2020.
- WHO Coronavirus disease (COVID-19) dashboard. World Health Organization website. https://covid19.who.int/. Accessed October 30, 2020.
- Testing trends tool. Johns Hopkins University website. https://coronavirus.jhu.edu/testing/tracker/overview. Accessed October 30, 2020.
- Impact of opening and closing decisions by state. John Hopkins University website. https://coronavirus.jhu.edu/data/state-timeline. Accessed October 30, 2020.
- COVID-19 in Pennsylvania. Pennsylvania Department of Health website. https://www.pa.gov/covid/. Accessed October 30, 2020.
- Coronavirus Disease 2019 (COVID-19): Testing and data. City of Philadelphia website. https://www.phila.gov/programs/coronavirus-disease-2019-covid-19/testing-and-data/#/. Accessed October 30, 2020.
- COVID-19: Data. New York City Health website. https://www1.nyc.gov/site/doh/covid/covid-19-data.page. Accessed October 30, 2020.
- UNC-Chapel Hill CV-19 dashboard. Carolina Together: The University of North Carolina at Chapel Hill website. https://carolinatogether.unc.edu/dashboard/. Accessed October 30, 2020.
- SUNY COVID-19 case tracker. The State University of New York website. https://www.suny.edu/covid19-tracker/. Accessed October 30, 2020.
- Welcome to the COVID-19 data hub. Tableau website. https://www.tableau.com/covid-19-coronavirus-data-resources. Accessed October 30, 2020.
Biography Kate Verstreate is the
Data Project Manager of the Policy and Analytics Center (PAC) at the AJ Drexel
Autism Institute. Ms. Verstreate’s work focuses on analyzing administrative
health data as well as visualizing data across PAC projects. Ms. Verstreate
holds a Bachelor of Science in Human Biology from the University at Albany and
a master’s degree in Public Health with a concentration in Epidemiology from
the University at Albany School of Public Health. Contact Information Kate Verstreate, MPH: Data Project Manager, Policy and
Analytics Center A.J. Drexel Autism Institute